Measure with markers
This guide shows how to place markers on the graph to measure time and value differences between two points.
Steps
Place the left marker (green): hold
Ctrland click the left mouse button on the sample of interest.Place the right marker (red): hold
Ctrland click the right mouse button on a second sample.The Markers panel appears on the right side of the window.
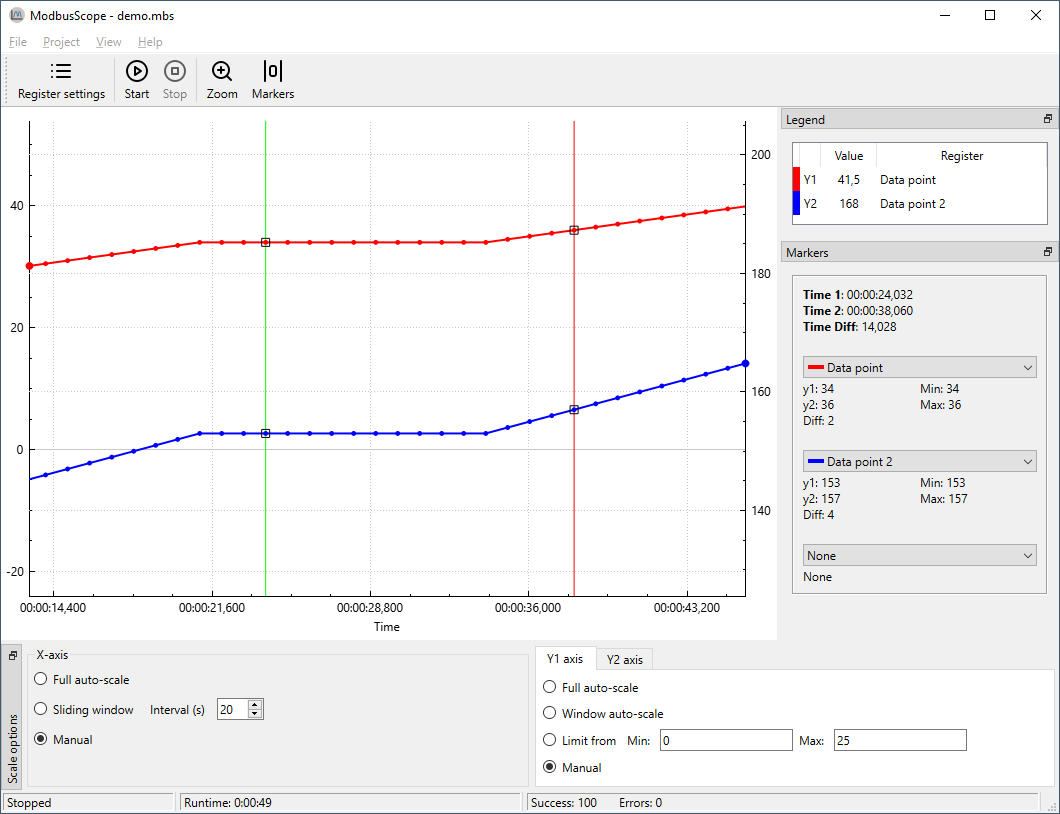
Read the values in the Markers panel:
Time 1 / Time 2: timestamp of each marker
Time diff: elapsed time between the two markers
Value: the register value at each marker position, per register
Value diff: the difference in value between the two markers, per register
To move a marker, hold
Ctrland click again at a new position using the same mouse button (left for left marker, right for right marker).
Result: The panel shows the time and value differences between the two selected samples.
Notes
Markers must be placed on actual logged samples. Clicking between samples snaps to the nearest one.
To remove markers, go to View > Remove markers or close the Markers panel.