ModbusScope documentation
Introduction
ModbusScope is a graphical user interface tool designed for logging and visualizing data using the Modbus protocol. It supports real-time data visualization, enabling users to see graphical representations of data while logging. The tool also allows users to export logged data to CSV files for further analysis. It’s highly configurable to suit various data logging needs and supports multiple Modbus devices simultaneously, making it ideal for monitoring devices in industrial automation, energy management, and environmental monitoring.
Features
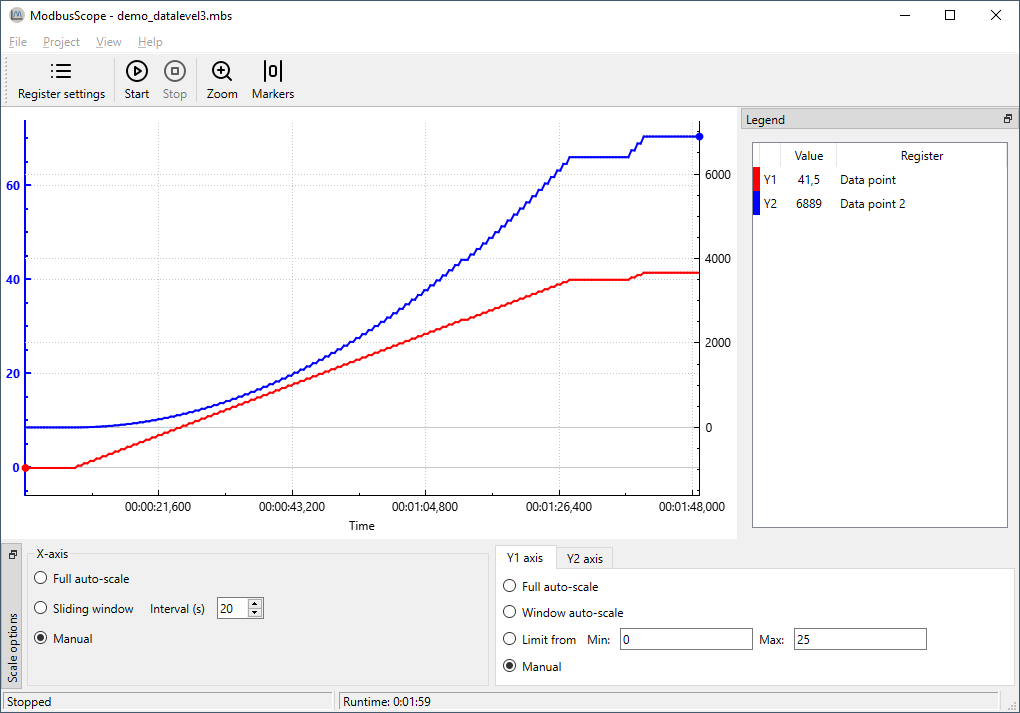
Real-time Data Visualization: Provides real-time graphical representations of Modbus data.
Zooming: Interactively zoom in and out of the graphs to focus on specific time periods.
Markers: Analyze data (min/max/average/…) within a specific time period.
Data Logging: Continuously logs data from Modbus devices for future analysis.
Multiple Device Support: Capable of handling multiple Modbus devices simultaneously.
CSV Export: Allows export of logged data to CSV files for easy analysis and sharing.
Data manipulation: Perform calculations and combine different multiple registers into one value.
Contents:
- Download
- Overview
- Graphview
- Configuration
- Diagnostics
- Importing and exporting
- Open data file
- Release notes
- v4.2.2 (28/04/2026)
- v4.2.1 (31/03/2026)
- v4.2.0 (09/01/2026)
- v4.1.1 (11/09/2025)
- v4.1.0 (03/07/2025)
- v4.0.1 (23/12/2024)
- v4.0.0 (18/06/2024)
- v3.9.0 (04/12/2023)
- v3.8.1 (12/08/2023)
- v3.8.0 (02/06/2023)
- v3.7.0 (03/02/2023)
- v3.6.3 (21/11/2022)
- v3.6.2 (06/11/2022)
- v3.6.1 (04/10/2022)
- v3.6.0 (02/10/2022)
- v3.5.1 (11/05/2022)
- v3.5.0 (04/05/2022)
- v3.4.0 (02/03/2022)
- v3.3.1 (23/12/2021)
- v3.3.0 (08/10/2021)
- v3.2.1 (15/04/2021)
- v3.2.0 (03/04/2021)
- v3.1.0 (23/02/2021)
- v3.0.0 (14/11/2020)
- v2.1.1 (03/07/2020)
- v2.1.0 (15/06/2020)
- v2.0.0 (03/03/2020)
- v1.6.1 (06/04/2019)
- v1.6.0 (25/01/2019)
- v1.5.0 (02/10/2018)
- v1.4.0 (17/02/2018)
- v1.3.0 (01/04/2017)
- Older releases